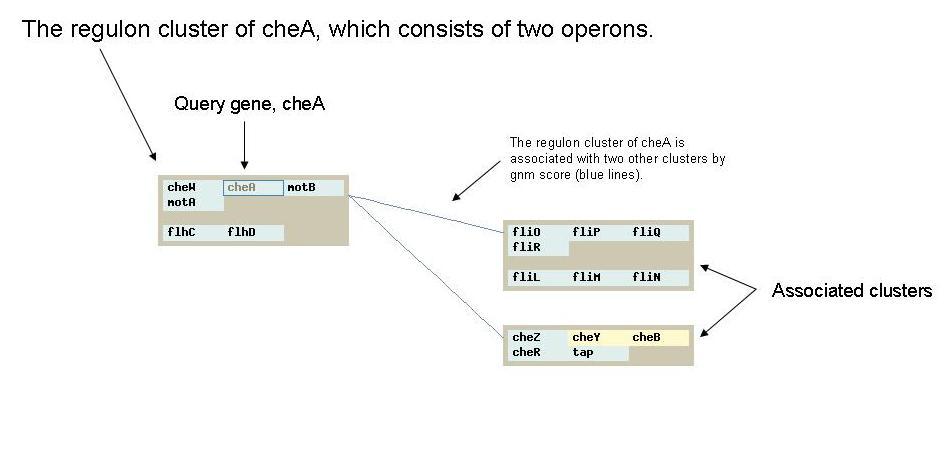
The image above shows the results of MicrobesOnline operon and regulon cluster predictions using our regulon browser. The image demonstrates the regulon cluster of cheA, in E. coli K12, and two associated regulon clusters based on a gene neighbor method.
Each regulon cluster is indicated by a grey box. Genes in a regulon cluster are shown as operons, as strips in light blue. If a gene has been annotated as a transcription factor, it is highlighted in light yellow.
The linkage between clusters are color coded indicating the evidence which supports the linkage: blue means gene neighbor score, red means microarray data and purple means both gene neighbor and microarray data.
The gene neighbor score asks how often orthologs of the two genes are near each other in other bacteria. It also includes a penalty if the genes are distant from each other in other genomes. It is described in more detail here (see "features"). We use the sum of pseudo-log-likelihood scores over different bacteria, including penalties.
Updated on June 21, 2007